The Hidden Costs of Our City Budget
Deferred Repairs, Lost Taxes, and Missed Opportunities
Authors/Collaborators: Nathan Biller, Anna Carley, Adam Tauno Williams, Laura Cesa, & Janelle Rai
Grand Rapids looks financially healthy on paper. Dig deeper, and a troubling picture emerges: only 70 cents in liquid assets for every dollar owed, while critical infrastructure deteriorates faster than the city is repairing it.
In 2024, I showed how Grand Rapids’ dense downtown quietly subsidizes the rest of the city. Parcel by parcel, the data made it clear: when we allow more people and businesses to cluster together and scale vertically, we generate the tax base that pays for everything else. When we freeze neighborhoods and don’t allow them to grow, this compounds our financial problems.
This new analysis builds on that insight by decoding the city’s own financial reports. The results are both encouraging and alarming. On paper, Grand Rapids is technically solvent, but that solvency comes with big caveats. Here are the headlines:
Short-term surpluses, long-term costs. We’ve balanced budgets in part by deferring maintenance, letting our infrastructure wear out faster than we repair it. Every year we delay, the repair bill grows. Last year’s water main break is an example of what happens when we don’t keep up on maintenance.
Zoning inertia is costing us millions. By dragging our feet on upzoning, Grand Rapids has missed out on nearly $20 million per year in property tax revenue since 2010; money that could have paid for better streets, parks, and services.
Outside aid is drying up. Pandemic relief funds are fading, and while state revenue sharing has ticked up, it now makes up a shrinking share of the budget. Without stronger local revenues, we will be vulnerable to cuts we can’t control.
We’re technically solvent, but fragile. Our financial position is improving, but we’re still about 30% shy of true solvency if you measure assets against liabilities realistically. Closing this gap will be key to long-term stability.
Together, these findings tell a story: Grand Rapids has been making the numbers work year-to-year, but we’re not building a foundation for long-term stability. Just like with zoning, the choices we make today will determine whether future residents inherit a resilient city—or one that is fragile and increasingly expensive to maintain.
What follows is a breakdown of how the Strong Towns Financial Decoder helps reveal these truths and why transparent accounting is the key to unlocking every other reform we care about.
About This Methodology
StrongTowns recently developed a framework using Indicators of Financial Condition—established metrics from Canada’s Public Sector Accounting Board (PSAB) and the U.S. Governmental Accounting Standards Board (GASB). These best-practice indicators assess municipal financial health across three lenses: sustainability, flexibility, and vulnerability.
The underlying data isn't new; the Comptroller publishes it annually in reports to city leaders and residents. What's new is applying the Strong Towns framework to extract actionable insights for better decision-making.
Join us as we dig into the Financial Decoder. Note: Each of the “what it is”, what it tells you”, and “what the trend shows” was written by our national organization StrongTowns and provided as part of their Financial Decoder Workbook. We’ve duplicated that here for context, but want to credit them with the work
Sustainability Indicators

Net Financial Position
What it is:
The difference between the city’s financial assets (like cash and receivables) and its liabilities (like debt and pensions). This is the cumulative surplus/deficit that the city has accumulated through successive budget cycles.
What it tells you:
A positive net financial position suggests the city has more financial assets than obligations and is in a better position to weather downturns, invest in infrastructure, or respond to emergencies without resorting to borrowing or service cuts. If this number is negative, the city has spent more than it has saved and is relying on future revenue to pay past bills.
What the trend shows:
A downward trend means the city is growing more reliant on borrowing or deferring payments. An upward trend means it’s becoming more financially secure.
GR Specific Analysis:
Past spending will need to be paid for with future revenues. GR is almost back to where it was in 2010, and since 2018, we've been steadily growing our annual surplus to dig ourselves out of this hole. Upzoning to allow greater density could speed up this process, as it adds property tax and income tax with negligible incremental infrastructure costs.

Financial Assets-to-Total Liabilities
What it is:
The city’s financial assets—such as cash, receivables, and other short-term holdings—divided by its total liabilities. This is a different way of presenting the Net Financial Position.
What it tells you:
This ratio shows whether the city has enough liquid financial resources to cover what it owes. A ratio below 1 means it would not be able to pay off its liabilities using only its financial assets, which is a sign of financial stress.
What the trend shows:
A rising trend means the city is improving its financial buffer. A falling trend suggests the city is becoming less able to handle its obligations without borrowing or cutting services.
GR Specific Analysis:
Most cities report their Net Financial Position as total assets to total liabilities. But you can't sell a road to pay for a liability, so a better metric is current assets (money in the bank) to total liabilities. A ratio of 1 means we're solvent. Anything less means we're not. The upward trend is good news, but we're still about 30% shy of being solvent.
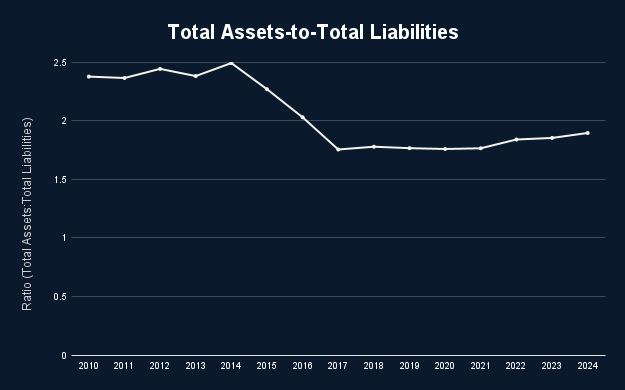
Total Assets-to-Total Liabilities
What it is:
The value of all the city’s assets (including infrastructure) divided by its total liabilities.
What it tells you:
A ratio above 1 means the city owns more than it owes (solvent). Below 1 means it owes more than it owns (insolvent).
What the trend shows:
A downward trend means the city is becoming less solvent. An upward trend shows improving financial resilience.
GR Specific Analysis:
Grand Rapids is solvent (on paper)! After a concerning drop between 2014-2017, GR has been slowly improving.
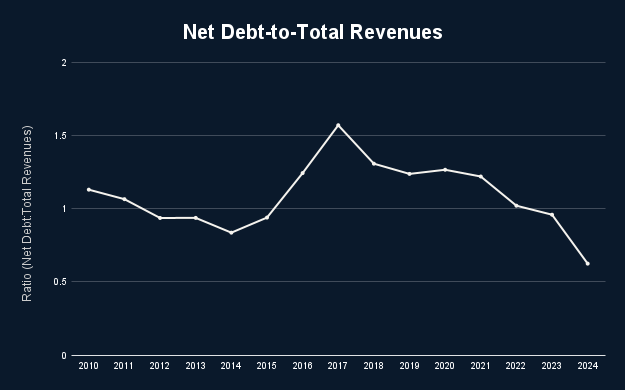
Net Debt-to-Total Revenues
What it is:
The total liabilities the city owes compared to how much revenue it collects in a year.
What it tells you:
This shows how many years of income it would take to pay off all debts if every dollar went to debt repayment.
What the trend shows:
If the ratio is rising, debt is growing faster than income—this is unsustainable. If it’s falling, the city is gaining control of its obligations.
GR Specific Analysis:
The downward trend is a good sign, especially as interest rates continue to rise and economic conditions tighten. A rising ratio would mean that a growing share of future revenue is already spoken for. A falling ratio means we have options.
Flexibility Indicators
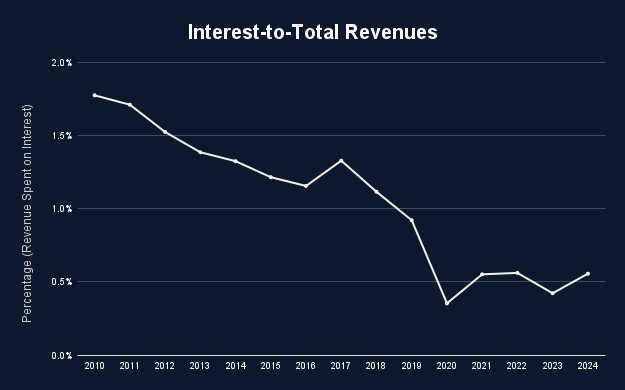
Interest-to-Total Revenues
What it is:
The percentage of annual revenue spent on interest payments.
What it tells you:
This shows how much of the budget is consumed by past borrowing. The higher the percentage, the less room for services, maintenance, or investment.
What the trend shows:
An increasing trend limits future choices and can crowd out basic services. A decreasing trend improves flexibility and budget health.
GR Specific Analysis:
This chart shows that one source of our recent fiscal improvements is from lower interest rates. As GR has been accumulating liabilities, interest rates have reached historically low levels and reduced the share of the budget dedicated to paying interest. Now that interest rates have risen, refinancing to lower rates isn't possible, so more of the city's budget will go towards paying interest.
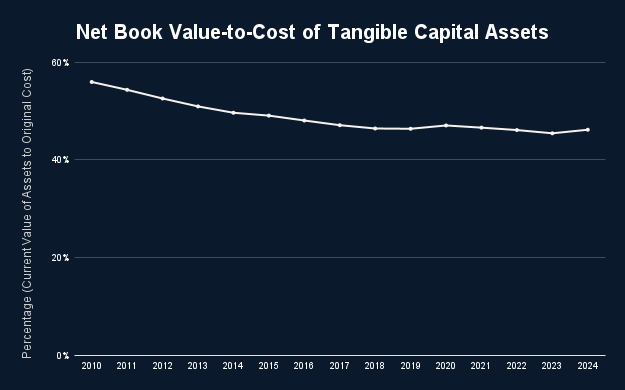
Net Book Value-to-Cost of Tangible Capital Assets
What it is:
The current value of the city’s physical assets compared to their original cost.
What it tells you:
This indicates how well the city is maintaining its infrastructure. A low value means assets are aging and wearing out.
What the trend shows:
A declining trend means the city is falling behind on maintenance. A stable or rising trend suggests it is keeping up.
GR Specific Analysis:
Deferring maintenance on our core infrastructure systems has contributed to our recent budget surpluses.
Because our infrastructure is depreciating faster than it is being repaired (i.e., the downward slope), repair costs are expected to increase in the future.
In GR, the remaining useful life of our infrastructure has declined from 55.9% in 2010 to 46.1% in 2024. This is a sign that the city is not keeping pace with its maintenance obligations. Every year that maintenance is deferred, repair costs increase, pushing GR into financial distress.
Extra Credit: Not originally a part of the ST Decoder

Surplus/Deficit
What it is:
The extra money available after meeting operational needs (surplus) or the amount required to maintain services (deficit). A surplus provides financial flexibility for investments beyond core operations, while a deficit necessitates borrowing or service reductions.
What it tells you:
A surplus allows the city to reinvest in infrastructure, services, or financial reserves. A deficit requires difficult trade-offs, such as borrowing or service cuts.
What the trend shows:
If the gap between surplus funds and the declining asset value continues to grow, GR may be prioritizing short-term financial stability at the expense of long-term infrastructure resilience. A shrinking net book value suggests that surplus funds should be strategically directed toward asset maintenance, preventing deferred maintenance from escalating into costly future repairs.
GR Specific Analysis:
GR has a healthy surplus, but the negative trend in capital asset valuation suggests a growing infrastructure gap. Redirecting funds toward asset maintenance and strategic reinvestment would help sustain the city’s physical foundation, ensuring long-term financial stability and reducing future liabilities from deferred maintenance. A true StrongTowns approach wouldn’t just redirect this surplus broadly; instead, we’d push for a bottom-up approach: test small-scale investments (maintenance, Vital Streets, DASH service, pedestrian safety, or bike lanes), measure productivity, and reinvest where returns are strongest. The path to resilience is not just maintaining infrastructure broadly, but prioritizing high-return investments at the block and neighborhood scale, ensuring that every dollar spent builds lasting wealth for residents. For example, investing in or subsidizing ADUs.
Vulnerability Indicators
Government Transfers-to-Total Revenue
What it is:
The share of the city’s income that comes from state or federal aid.
What it tells you:
High dependency on outside funding makes the city vulnerable to political or economic shifts beyond its control.
What the trend shows:
If the trend is rising, the city is becoming more dependent on outside help. If it’s falling, the city is strengthening its local revenue base.
GR Specific Analysis:
The pandemic relief funds are running out, and GR should strive to replace these temporary funds with more permanent revenue streams (like legalizing dense developments, which bring reliable, inflation-adjusted, perpetual revenue.
Extra Credit: Not originally a part of the ST Decoder

Unrestricted Shared State Revenue
What it is:
The funds that the State of Michigan gives to GR without specific spending requirements (e.g. sales tax distributions and revenue-sharing agreements). GR can use this money flexibly, often for general operations, infrastructure, or balancing budgets.
What it tells you:
High dependency on outside funding makes the city vulnerable to political or economic shifts beyond its control.
What the trend shows:
If the trend is rising, the city is becoming more dependent on outside help. If it’s falling, the city is strengthening its local revenue base.
GR Specific Analysis:
Over time, Michigan is sharing less money with GR, although since 2020, this trend has been reversing. It's good to see that even with this increased state funding, as a % of GR's total revenue, it's shrinking. This indicates GR is diversifying its revenue streams to depend less on the state.

Property Taxes
What it is:
The orange line represents the total property tax revenue collected within GR. The white line shows this figure as a percentage of the city’s total revenue, illustrating how property tax fits within broader fiscal trends.
What it tells you:
While property tax revenue has grown 43% since 2010, its shrinking percentage of total revenue suggests that GR is increasingly relying on alternative funding sources.
What the trend shows:
If the white line is falling, while the orange line is increasing, GR is relying less on property tax revenues due to other income sources.
GR Specific Analysis:
GR hasn't been very aggressive in upzoning properties to allow incremental density and the higher property tax revenues that come with more dense property. If we were still at 2010's 13.4% of total revenue, our property tax revenue would be almost $20M higher each year, indexed to inflation! This is the cost of us dragging our feet on updating our zoning for over a decade.

Tax Revenue as a Percentage of Total Revenue - View 1
What it is:
The white and orange lines represent revenue as a percentage of the whole for income and property tax, respectively.
What it tells you:
Grand Rapids is attracting higher-income residents, leading to rising income tax collections. However, with a limited supply of high-end housing, these residents bid up older housing stock, accelerating appreciation beyond the 5% cap on taxable value growth. Since Michigan law limits how much taxable value can rise annually, the city struggles to fully capture the benefits of rising home values.
What the trend shows:
If the gap between property tax revenue and total revenue keeps shrinking, GR will rely more on income tax while missing out on property tax revenue growth. Since the taxable property value is capped at a 5% increase annually, appreciation beyond this limit means the city fails to fully leverage rising home values. Increasing housing supply could help keep appreciation in check while ensuring the city collects more revenue.
GR Specific Analysis:
Grand Rapids is currently experiencing an all-time high difference between State Equalized Value (SEV) and taxable value, as reported by the city’s assessor. This gap represents lost potential revenue, as rising home values exceed taxable growth limits. If Grand Rapids allowed more housing construction, annual appreciation could stay below the 5% cap, enabling the city to capture additional property tax dollars while maintaining affordability. Expanding housing supply would stabilize home prices, reduce dependence on income tax, and maximize property tax potential.

Tax Revenue as a Percentage of Total Revenue - View 2
What it is:
The same information as above, just with the rest of the revenue added in for better context.

Tax Revenue as a Percentage of Total Revenue - View 3
The same information as above, just with the rest of the revenue added in for better context. This version normalizes the numbers by displaying them as percentages to allow for easier comparison of the proportional tax revenue over time.
In Conclusion
When I first looked at Grand Rapids parcel by parcel, the lesson was simple: dense places generate the wealth that sustains our city. This deeper dive into our financial reports tells the same story from another angle: without transparency and long-term thinking, we risk squandering that wealth.
The Financial Decoder shows us that Grand Rapids is solvent on paper but fragile in practice. Surpluses built on deferred maintenance, lost tax revenue from outdated zoning, and dependence on temporary aid all point in the same direction: we’re living off short-term fixes instead of building lasting stability.
The good news is that the solutions are within reach. Legalizing more incremental housing, prioritizing maintenance before expansion, and demanding clear, transparent accounting aren’t abstract policy goals; they’re practical steps that will leave the next generation with stronger streets, healthier finances, and more choices.
Strong Towns aren’t built overnight. They’re built choice by choice, budget by budget. By connecting the dots between how we grow and how we account for that growth, we can steer Grand Rapids toward a future that is not only solvent on paper, but resilient in reality!
If you’d like to see this data in the original Finance Decoder spreadsheet, or dig into the source data our workbook is available here: https://docs.google.com/spreadsheets/d/17W65-zEmYC-EGmPURyRfvd6AANXYG9qyo8_CNJD921U/edit?usp=sharing
We did share our findings with the City Comptroller, Charles M. Frantz, who invited us to present to his entire department and discuss our findings.
How can you help?
A couple of reminders for things you can get involved with to help us champion:
Budget season happens in January/February, so it’s a great time to write your Commissioners with your priorities.
The ADU Task Force is scheduled to present to the Committee of the Whole and the City Commission in November.
The rewrite of our Zoning Ordinance based on last year’s newly accepted Community Master Plan will soon be underway. There will be public engagement meetings throughout to share your feedback.
We do have StrongTowns representation on both the ADU Task Force and the Technical Advisory Committee for the Zoning Ordinance rewrite, but showing up and showing support is the best way to ensure we’re transforming our city for the better!
Caveat lector: 2019 mentioned some restating of financials. To save time, I pulled two years at a time, since each report shows both the current and prior fiscal year, so I may have missed something that got restated. If anything looks off, or you identify any errors, please let me know, so I can get it updated!